There are a lot of great blog posts and online tutorials covering a wide range of data science topics online. Whether you’re struggling to create your first ggplot, or if you’re pursueing the latest machine learning techniques in R, you’ll probably find hundreds of resources in our great community. However, there is one topic that I think is under represented, and that topic is project management.
Proper project management might sound trivial at first, but it’s essential to keeping your projects organized, reproducable, and secure. Just a few moments of forethought and effort can save you hours of pain and regret later. Check out these tips and habits that I’ve found keep my projects in tip-top shape.
Creating a Project
The very first thing I do when I’m starting a data science project is to create a project folder. Anything and everything associated with your new project will live in this local project folder, so give it a good name. I always use snake_case while working with programming projects. snake_case creates consistency and makes navigating files in the terminal a breeze. Once I’ve created te project folder I’ll change my working directory to the project folder and create a text document. In this text document, I write a small project overview, putting my project ideas into words and goals. Once my project has a name and direction, I initiate a git repository to start tracking my progress.
Version Control
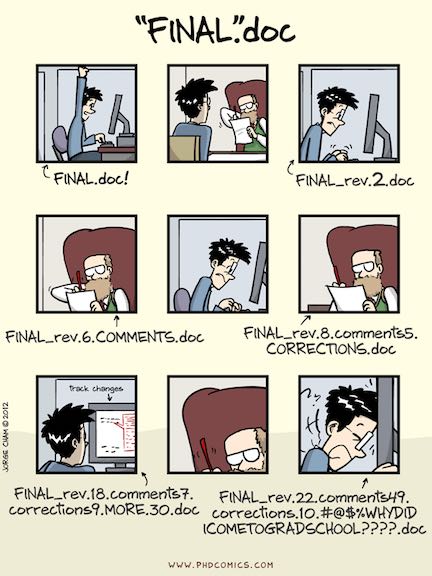
If this comic accurately describes you, you’re probably not using version control. Version control is the task of keeping a software system consisting of many versions and configurations well organized. Git is the one true diety in the world of version control.
Creating git repositories and interfacing with Github is an entire series of blog posts by itself. For the purposes of this post I’ll just point you to Data Camp’s Introduction to Git for Data Science. It’s a free, high-quality, four-hour course that teaches you everything you need to know about git. While you’re there, check out Introduction to Shell for Data Science as well.
Data Source
Once your git repository is up and running, it’s time to gather data! If you’re working on a professional project you’ll probably gather data from an SQL server or network database. If you’re working on a personal project, you have a near infinite number of choices for gathering data. Check out some this DataQuest article on where to find some interesting datasets.
Once you’ve downloaded the data you would like to work with, you should never overwrite this original dataset. If you do want to make changes to your data, and you likely will, you should save the newer versions as such. Commonly, I’ll change datasets into .csv or .txt files and change the encoding to UTF-8 among other things. If you’re changing anything within the data, such as setting blank values to N/A, make these changes using R scripts and save the scripts for posterity. I’ve written a blog post on effectively importing data into r using the readr library.
Project Structure
Where do the datasets go? Where should the plots and scripts and markdown documents go? Instead of throwing all your files into the project folder and calling it good, try to keep your project structured with sub-folders. My projects always end up looking something like this:
turtle_analysis/
|- input/
|— about_turtles.txt
|— ocean_temp.csv
|— turtle_sizes.csv
|
|- scripts/
|— turtle_eda.Rmd
|— turtle_height_plot.R
|— turtle_width_plot.R
|
|- output/
|— turtle_height.png
|— turtle_width.png
|
|- final_analysis.Rmd
|- final_analysis.html
|- final_analysis.md
|- README.md
I use three main folders inside a project folder, input, scripts, and output. input/ is where all the datasets related to your project reside. Remember, even if you don’t use the original, unaltered dataset, it’s still best to keep a copy of it. The scripts/ folder is where all your programming goes. If you alter the dataset in any way, do it with a script, and save that script! If you create any plot, table, or calculation that may be useful, save the .R or .py file in in scripts/. Every script you create should explicitly load input files and explicitly save output files. finally, the output/ folder is where any figures that you create using scripts reside.
Outside of these three folders I’ll create the final analysis, cherry-picking my favorite scripts and figures, adding a text explanation to create a compelling data-driven story. README.md files are useful for displaying your project in an easy to read manner on github. These can easily be created from an R markdown analysis file.
![]()
R Markdown
R markdown documents are awesome! If you’ve never used an R Markdown document before, check out Chapter 27 of Hadley Whickam’s free book R for Data Science. It’s a pretty quick read, within 30 minutes you should be up and running with R Markdown. If you need further assistance, refer to the R Markdown Cheatsheet by RStudio.
R markdown documents are great for exploratory data analysis because you can quickly iterate through plot versions and easily keep notes on what you’re doing in the same document. Once you’ve found something that is worth keeping, simply open up a new .R script copy and paste the associated code (including the explicit load and save commands), and move on to the next problem.
Once your done working through your project, open up a new .Rmd file and glue together your best scripts with explanation text. Before you know it, you’ll have a summary document worthy of sharing! With the click of a button, RStudio can ‘knit’ your R Markdown document into github-flavored markdown, normal markdown, .html, .pdf, and more.
Blog Posts
If you’re interested in making blog posts from your analysis, just as I do on this very site, R markdown is going to be your best friend. This site is created using Jekyll, the static site generator. Read more about Jekyll here. It is hosted for free on github pages. Read more about github pages here.
![]()
Once I’ve finished my analysis in R markdown, I knit the file into a markdown (.md) document using the knitr library. To change your output to .md, alter the YAML header of the R Markdown document to “output: md_document”. Save and proceed to knit the document, and boom, final_analysis.md appears in your project directory along with its associated images.q
Using your favorite code editor (mine is Visual Studio Code), copy the markdown document into the posts/ directory of your websites blog, and copy the associated images to the images/ directory. After a few minor tweaks push a github commit and your blog will be updated with the new post! Cool!
The Take Away
- Use snake_case when naming files and folders!
- Use version control!
- Never overwrite your original dataset!
- Explicitly load inputs in your scripts!
- Explicitly save outputs in your scripts!
- Keep a project folder tidy with 3 sub-folders!
- R Markdown is awesome, try it!
- Making a blog is easier than you think (and free), try it!
That’s all for now!
Until next time,
- Fisher
Comments