The best way to understand theoretical statistics is by creating gambling applications in R! This probability simulation dives deep into expected values. My dice function is a fun way to visualize and better understand the central limit theorem and large of law numbers. I've even created a slot machine function to better understand R's object oriented programming system.
I really enjoy interactive data visualization using a variety of technologies. This 3D image was created with Plot.ly in R.
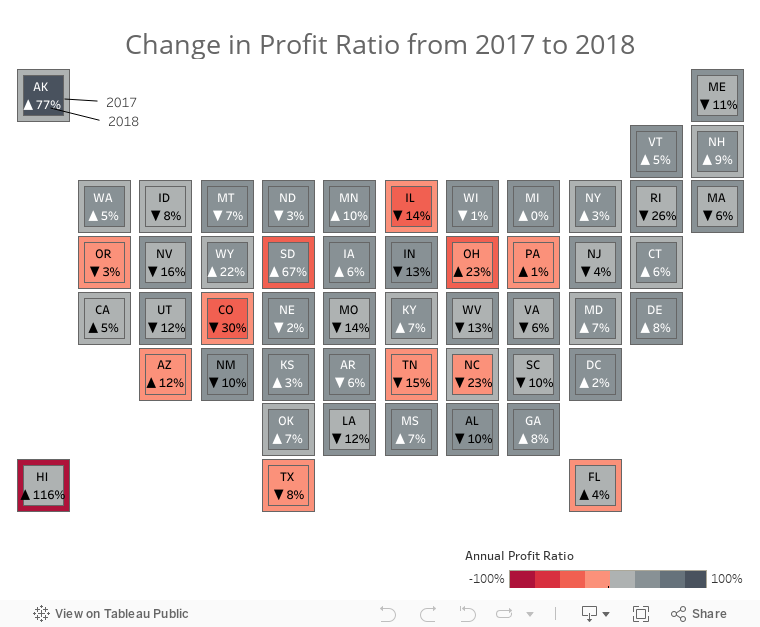
You can't mention interactive visualizations without talking about Tableau. Here's a recent dashboard I made to to map a fictitious year over year profit ratio in a unique way.
I've even used Geospatial packages in R to plan out my next trip to Greece using open source AirBnB data!